
Last week calm returned to markets although there has been no real change in US policy outcomes, yet. We are 30 days into the 90-day pause and constructive developments around trade policy negotiations have been piecemeal and provisional at best. Meanwhile, the US and China have been more restrained insofar as there has been no further escalation in trade measures. Progress towards de-escalation has been minimal, though upcoming talks between officials of the two nations are a positive sign even if we expect that China is only playing for time. China/US trade is currently frozen by the tariffs and yet the markets do not appreciate that with each new day of no change, the risks of disruption to the global supply chain rise. This will impact all the developed world – not just the US or China – because the entire developed world relies on the same global supply chain. This is a simple fact aptly demonstrated by the pandemic lockdowns and yet the equity and credit markets are blind to the consequences.
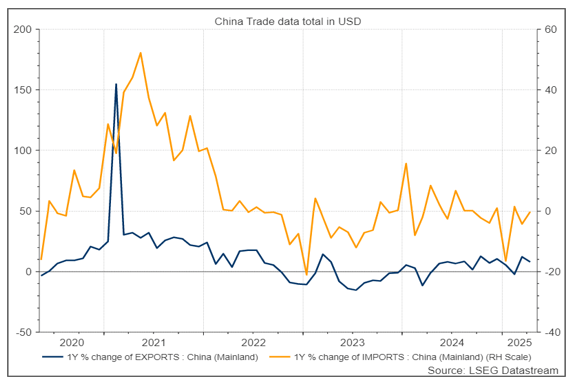
The China import and export data, released last week is informative. China’s April trade data beat market expectations and seasonality. In USD terms, exports rose by 8.1% y/y and imports decreased by 0.2%, both much higher than market consensus. On a monthly basis, China’s exports rose by 0.6%, outperforming the average month-on-month growth of -0.4% recorded between 2022 and 2024.
The UK is the only country to sign an official agreement with the US, although, this is being billed as more of a ‘framework’ than a ‘deal’. The only actual tariff reduction agreed to, under this framework, was a commitment to cut the car tariff from 25% to 10% on the first 100,000 vehicles exported from the UK. In return the US gets a small tariff free quota for beef and ethanol exports into the UK. This deal is almost not worth mentioning. The UK is 2% of total US imports and of this, the tariff deal applies to only 14%. This is a deal that lowers the price for US buyers of Aston Martins and Bentleys, slightly! At much the same time, the tricky Commerce Secretary, Lutnick, is claiming that he has done a deal to exempt UK aircraft engines and parts from tariffs and a deal for the UK to order to US$10bn of new Boeing aircraft. It is worth noting that even Boeing could not justify announcing this to the market so it may not be real.
The significant tariff change last week was the quiet decision to indefinitely delay the tariffs on Canadian & Mexican Auto parts tariffs.
This focus by the Trump Administration on US beef access to foreign markets borders on the absurd. The US has a beef production deficiency – not a surplus. This is why beef prices are so high in the US and why Australian beef is being purchased in such a large quantity. The US beef industry doesn’t need a tariff free agreement with the UK because they can get more for their beef in the US domestic market.
The Trump Tariff policies are looking more and more like just an exercise in government interference in the free market. It is certainly inflationary.
The US reported a 0.3% contraction in its quarter-to-quarter GDP for Q1 2025. The decrease in the first quarter is driven by an increase in imports, which are a subtraction in the calculation of GDP, and a decrease in government spending. Data releases showed that pre-tariff imports increased by 41.3% in the first three months of the year. Imports soared to $346 billion in March, which consequently led to the widening of the trade deficit as it reached $163 billion. Consumer goods led the surge in imports, with significant increases in automotive vehicles and capital goods. The Trump Administration’s fiddling here on tariffs is only distorting the markets in the very short term and the actual impact on consumption and GDP growth in aggregate may be tiny.
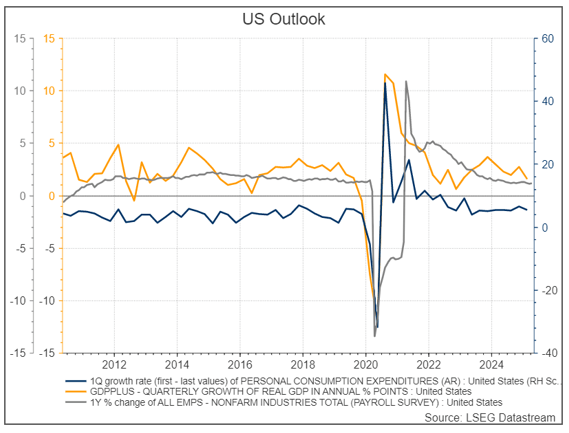
These movements were partly offset by increases in consumer spending and exports. Even though the tariffs had not been fully implemented during the first quarter of the year, it still triggered significant imports as businesses tried to front-load purchases ahead of the implementation of the tariffs. The key date here is April 9 as goods on the water before that date are Tariff free. As such, we cannot rush to judgement on April data releases with the real trade impacts only appearing in May, but this week’s wholesale inventories may see a huge surge.
Interest Rates
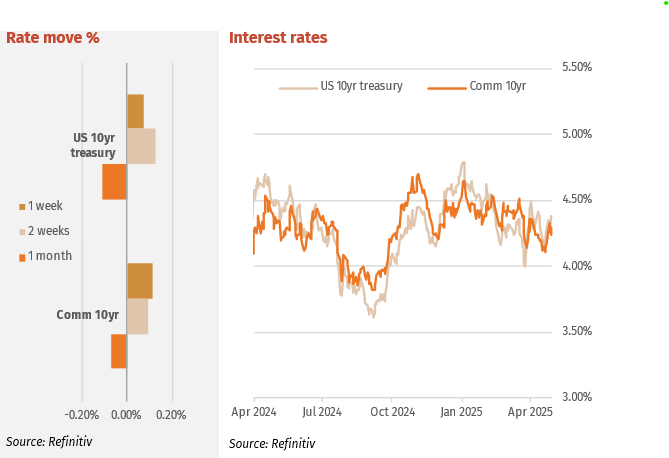
The US bond market remains far more nervous about Trump policy outcomes and may yet force changes if it judges that the debt pile will spike higher in the months ahead. The US 10-year yield moved from 4.31% to 4.38% over the week and the 2-year yield also tracked higher from 3.83 to 3.89%. The US 3-month T-bill yield also rose 1 bp to 4.23%, still within the range since mid-December but threatening now the 4.24% level that would indicate a breakout. This indicator needs to be watched this week.
Australian Sovereign bond yields finished the week higher post the Federal Election. The 2-year yield climbed from 3.29%to 3.34% while the 10-year tracked the move in US yields from 4.16% to 4.25%
(NY closed 6 bps higher on Friday night). The markets appear to believe that the ALP will not make major policy changes and focus on improving productivity, ignoring the huge spending election promises. There is also an assumption that the ALP Green Senate majority will see the easy passage of legislation, but the Greens may cease any co-operation with the ALP in this government term because of the way the ALP targeted them in the election.
Major Credit Markets
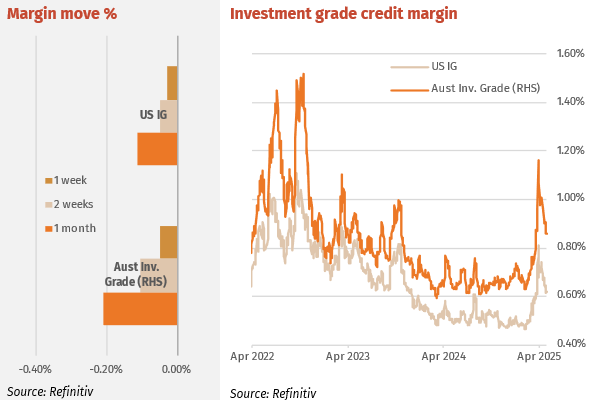
As volatility falls, especially in measures such as the VIX (down to 21.90 vs. 50 in early April), credit markets continue to recover. Investment grade spreads are in 2-3 points since April however are still 20 points wider YTD.
The eerie calm that spread over all global credit markets may well prove to be a false dawn. The corporate credit market has re-opened with tepid buying in the secondary market returning. ANZ issued a 12-month senior and NAB a 3-year senior bond quickly after reporting results. The choice of tenor kept 3-year margins at 74bps and 4-year at 82bps for other major bank seniors. The 5-year margin is now into 85bps and looking relatively expensive. Tier 2 bank sub debt was well sought after all week with spreads on the Kanga T2 coming into near the margins prior to the Liberation Tariffs in early April. Aurizon issued $250m Senior rated BBB- at +280 bps on Friday. This issue had a huge bookbuild and priced well inside the +300bps valuation suggests.
High Yield Markets
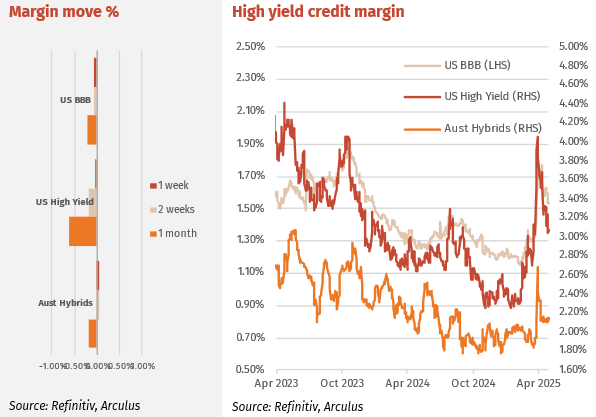
Globally high yield (HY) markets continue their recovery rally but still well-off March lows. BB spreads have retraced 18 pts in past weeks but are still wider by 29pts YTD. CCC has recovered 41 pts in past weeks but 188 wider YTD. As we commented several times in March, spreads for most HY classes were near multi-year lows. History shows HY spreads to not stabilise for long.
The sideways move in hybrid spreads continues despite most credit markets continuing to rebound. Hybrids volume fell slightly below the $30m per day average. That plus little or no moves in margins signals interest is waning in the sector. Despite that there were some margin moves; at the short end NABPF tightened where as CBAPI rose, most 2027-28 hybrids moved wider in margin, whereas past 2028 margins were steady.
Listed Hybrid Market
Hybrids – margin recovery comparison
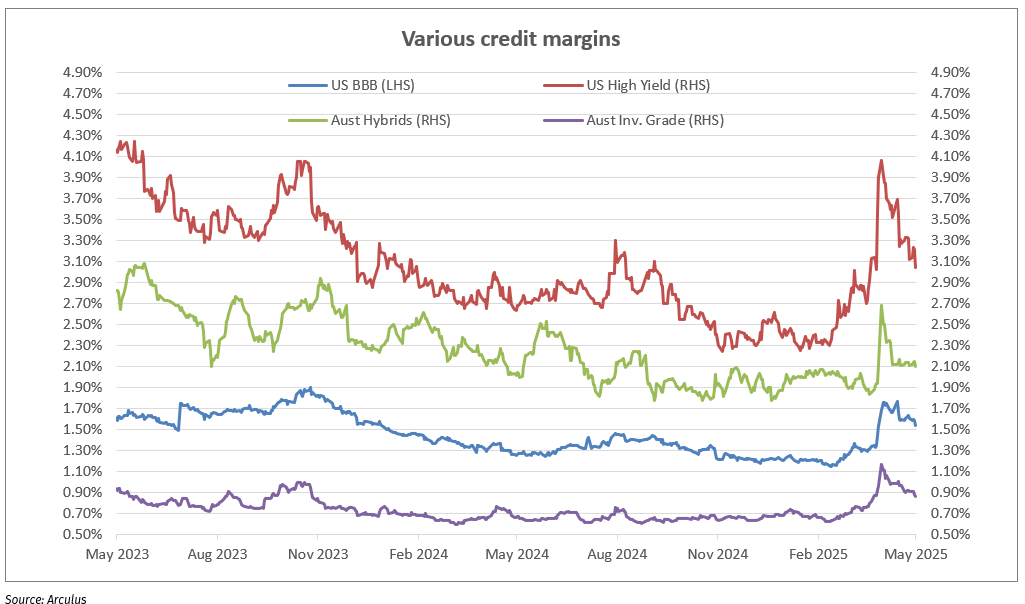
As mentioned above, in recent weeks hybrid markets have tracked sideways as other credit markets continue to recover. Hybrid margins are still above pre-Liberation Day levels, however these current levels are just above levels in February/March. Hence has the hybrid recovery run its course? Why are other credit markets still rallying? The chart below shows the average major bank hybrid margin, the average US HY margin, US BBB margins and the Australian investment grade iTraxx margin. The recovery of each can be seen and previous levels. We will use March 1 as a comparison date as each of these markets did weaken in the run up to April 2 at different times over March. Compared to March 1, hybrids now still sit 8% higher (that is 108% of the March 1 level), US HY 18% higher, US BBB 25% higher and Australian iTraxx 28% higher. Hybrids have recovered best by a large amount. This may explain why the hybrid market is currently tracking sideways.
Forward Interest Indicators
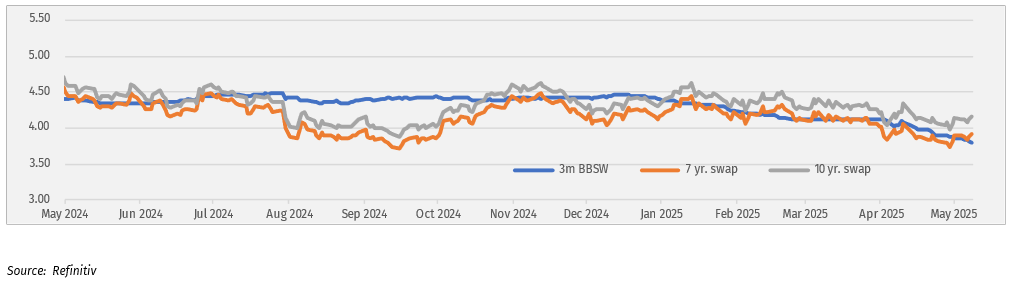
Australian rates
Swap-rates move with bond rate moves.
Swap rates:
- 10-year swap 4.15%
- 7-year swap 3.91%
- 5-year swap 3.69%
- 1-month BBSW 3.86%