
The exodus out of the US dollar has begun. There are three factors at play:
- Trump is targeting nations with large trade surpluses with the United States. The same nations have been reinvesting their trade surplus back into U.S. dollars. If the surpluses shrink so does the demand for U.S. dollars.
- China wants to purchase commodities not priced in U.S. dollars and has been actively trying to build a consensus with the BRICs full an alternative
- Central banks in Europe Asia South America have been shifting out of U.S. dollars and into gold.
The question is no longer is the US dollar going to fall but by how much?
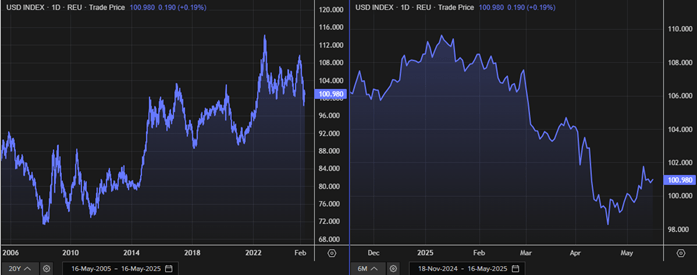
The flow of funds is now an important consideration the slight pickup in the US dollar last week probably reflects a flow of funds into equities principally from U.S. dollar block countries’ currencies like Australia and New Zealand as well as the oil rich Middle Eastern states.
The next 60 days will all be about US Tariff policy. The general 10% tariff on all countries would have to be one of the most stupid macro policy decisions ever made anywhere. If the USD does not rise to offset the tariff, then it will trigger an inflationary outbreak in the US. Perhaps the most stupid thing I have been told recently was by a bond trader the claimed that the US general country tariffs are “only inflationary initially” and that the Federal Reserve would look past them because like a GST imposition, they are non-recurring event. Opinions make a market but no doubt there were a lot of investors in the 1970s making similar claims about the oil price shock.
Inflation is a rolling stone that actually gathers moss
The longer that inflation is allowed to remain elevated the more permanent it becomes. This is why the RBA policy is to return inflation to 2.5% quickly.
The secular stagnation period from 2008 to 2019 has perhaps been long enough for investors and too many bond traders to remember how inflation actually works. Once inflation is in the system it is a self-feeding mechanism. Cost push inflation in the 1970s:
Oil Price increased
- Transport costs increased, plastics and other goods prices that use oil also increased
- Final goods prices increased, and higher transport costs also flowed into services prices
- Inflation increased, and damaged the household budgets of the less affluent
- Claims for higher wages to restore the household budget purchasing power occur
- The increased wages costs flow into final prices or all goods and services and inflation increases again.
You will have read a lot about the, so called, Australian household budget crisis prior to the federal election. Don’t expect the media to keep pushing this falsehood post the election. It will quietly fade out. If there were an actual household budget crisis it will be because wage increases have not kept pace with inflation in the public sector since the ALP government was first elected in May 2022 and we got a federal treasurer with no real economics education and in fact, a misplaced view of the way an economy actually works.
This then begs the question why hasn’t wages growth kept pace with inflation and why did the ALP in the middle of the election campaign call for a real wage rise (above inflation) at the next FWC minimum wage decision. Perhaps the most simplistic answer here is that the state and federal governments with an offer of job security we’re able to hold off passing actual inflation fully into nominal wages since 2022. No one in our media or amongst bank economists questioned why public sector employees were getting wage increases of only 2.6 percent when the CPI ratings were above 5% in 2023.
Well now with the election of the ALP federal government and probably the re-election of the Victorian ALP, we will see a rapid and significant increase in public sector wages and the government, at a state level, is the single biggest employer. These wage increases will bring cost push inflation back to Australia in much the same way they did in the late 1980’s, when despite a valiant effort by Bill Kelty and the ACTU to link wages growth with business investment that increased labour productivity, the lags in the system still caused an inflationary outbreak.
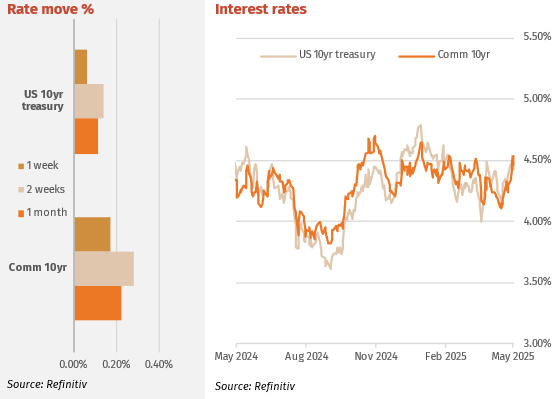
Interest Rates
The markets focus shifted back onto the US budget and debt funding requirements last week. Although the 10-year pulled back on Friday to close 4.48% from the weekly peak at 4.54%, the Moody’s US sovereign downgrade announced after the markets closed will see yields surge higher on Monday. Moody’s said the downgrade “reflects the increase over more than a decade in government debt and interest payment ratios to levels that are significantly higher than similarly rated sovereigns”. This downgrade will bring Moodys in line with Fitch and S&P who both many years ago had downgraded the US one notch from AAA. More bad news for bond rates is the surge in inflation expectation from consumer surveys, this may put upward pressure on rates not to mention the 40% of outstanding US treasuries that need to be refinanced in the next two years.
The Aussie 10-year yield tracked higher in line with the US long end with the short end still anchored by the markets certainty that a 25bps rate cut will be delivered by the RBA on Tuesday. With a rating cut likely on Victorias debt and the Aust. comm. Gov. debt soaring, Aust. is not fiscally attractive.
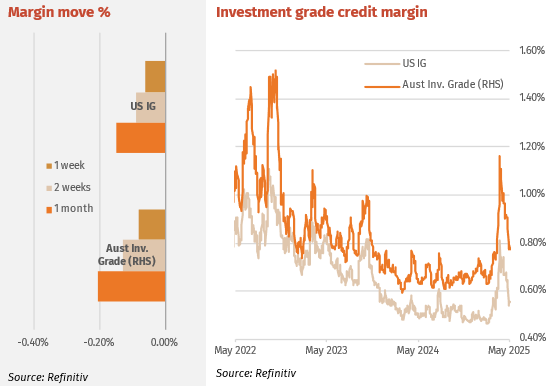
Major Credit Markets
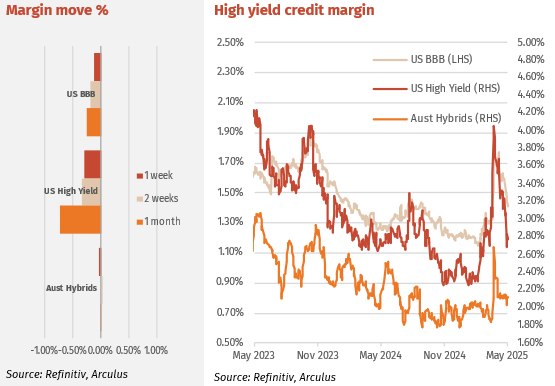
The rebounding credit rally continued for most of the week buy may end abruptly given the downgrade news as above. Late Friday night US time credit spreads had risen off Fridays lows which had mostly recovered after the large spike post Liberation Day. On Friday pre the downgrade news, high-grade US corporate spreads were wider by 12bp from YTD lows.
Strong demand returned to the Aussie IG market last week, perhaps, with offshore investors preferring AUD exposure to USD at the moment. ITraxx 5 year has now returned to 80. Mystate issued $100m Tier2 at a very tight +275bps, QBE issued $600m Tier 2 at +195bps and then on Friday People’s Choice -Heritage issued $100m at +250bps. These are all very tight margins for these issuers on an historical basis.
High Yield Markets
In a similar fashion to Investment grade markets, high yield (HY) markets continued to recover strongly but this also haled Friday night. One point worth mentioning is how HY markets have functioned during the volatility in April. In previous stress events HY markets have effectively shut with little trading however, in this recent stress period, HY markets have traded well with issuance continuing and secondary liquidity being good.
With equity markets strong and good bank stock support, hybrid spreads firmed over the week with average daily volume elevated well above the usual $30m per day average. The margin curve remains very flat after 2027 as a result of buying volumes high at the long end especially AN3PL and WBCPM. Hybrid with maturities before Jan 2028 have margins well under 2%.
Listed Hybrid Market
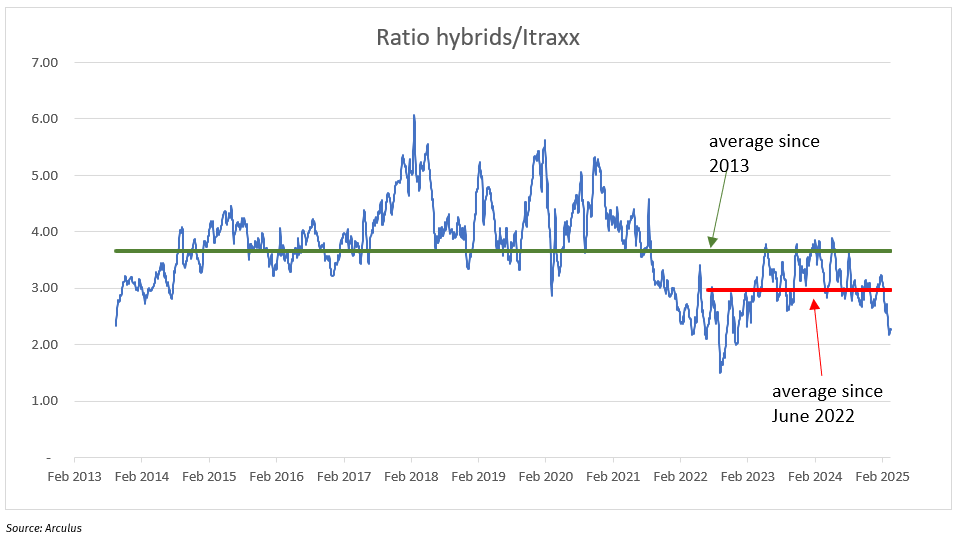
Hybrid Margin vs iTraxx: Relative Value Perspective
We regularly monitor the average major bank hybrid margin relative to the iTraxx index, expressing this as a ratio to identify relative value. The updated chart below highlights recent movements in both markets. In early April, both hybrid margins and investment grade (IG) credit spreads widened, though not in a synchronised fashion. This is typical: the IG credit market generally does not track hybrid margins, while the hybrid market tends to monitor IG credit only in the wake of significant market shocks or large jumps in credit spreads.
During recovery phases, coordination between these markets remains limited. Over recent weeks, we have been firmly in a recovery phase. As noted in last week’s commentary, hybrids have rebounded more quickly than comparable instruments such as bank senior and subordinated notes. This faster recovery has left hybrids looking expensive—whether compared to levels dating back to 2013 or more recently from mid-2022, when the RBA began raising cash rates. As discussed in the credit summary above, credit markets continue to recover. If this trend persists, we expect the relative outperformance of hybrids to moderate, potentially realigning with broader credit benchmarks.
Forward Interest Indicators
Australian rates
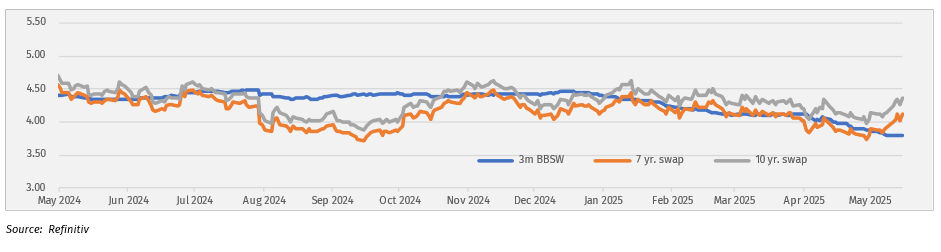
Swap-rates rise with bond rate moves.
Swap rates:
– 10-year swap 4.36%
– 7-year swap 4.13%
– 5-year swap 3.94%
– 1-month BBSW 3.79%