
US Economic Outlook
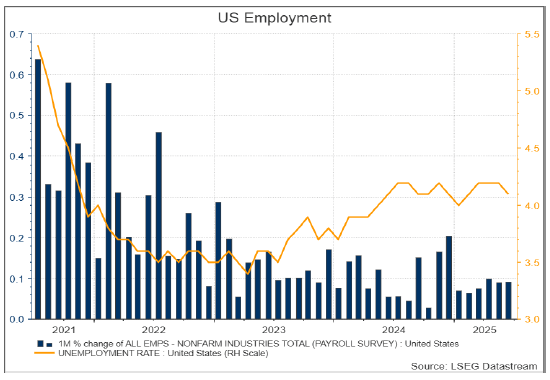
Last week’s non-farm payrolls number of 147,000 was far in excess of the market’s expectations of 110,000. Ordinarily we would not see this as significant for the bond market because a 125,000 monthly increase is required to keep the unemployment rate steady and so a reading in one month of either 147,000 or 110,000 does not alter the average levels enough to change our economic outlook. There are, however, reasons why this stronger than expected employment numbers may cause bond yields to surge back to the 4.5% level (10-year) again this week:
- The Trump tariff window expires and so far, the 20% general agreed tariff on Vietnam and through put tariff of 40% from China is not good news.
- The USD is still weakening and may go a lot further if Trump continues to undermine confidence in the Federal Reserve being politically independent.
Australian Inflation Outlook
Despite the narrative that inflation at a headline CPI level will fall to the RBA 2.5% target, and 2-3 rate cuts will be delivered, we still see a risk that inflation will begin to increase again in the second half of calendar 2025 and the RBA will be holding rates at a higher level than expected for a considerable period of time. In all likelihood, the path of least regret for our politically challenged RBA rate setting board will be to cut by 25bps in July, but it is increasingly likely one that they will regret in hindsight.
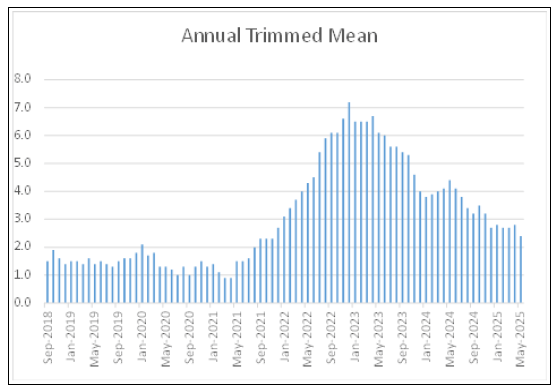
The following charts were assembled with data provided by the ABS. Monthly Consumer Price Index Indicator, July 2024 I Australian Bureau of Statistics (abs.gov.au)
Since the peak in late 2022, there has been a pattern of falling inflation in the seasonally adjusted CPI excluding volatile items and the all important Trimmed Mean which is the data the RBA uses to measure inflation.
There are then several ways to interpret this CPI data provided by the ABS.
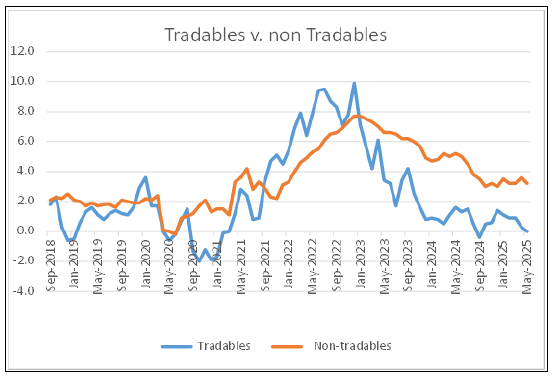
(1) Tradables inflation includes Household furnishings, clothing and footwear that have been consistently declining since the pandemic restrictions were lifted and the global supply chains were restored. Non-tradables inflation remains at a high level.
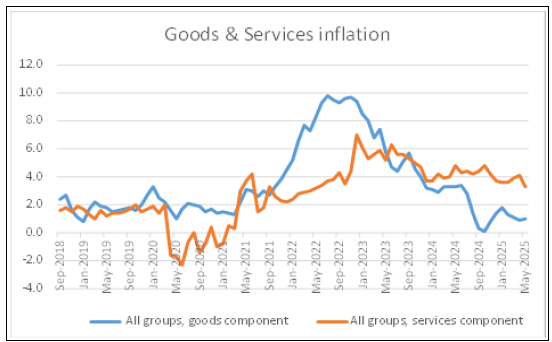
(2) Goods and services inflation shows a divergence with goods price increases back to long-term levels and services prices still at a high level. It is here that the recent Fair Work Commission minimum wage increase of 3.5% will begin to have impact from July this year.
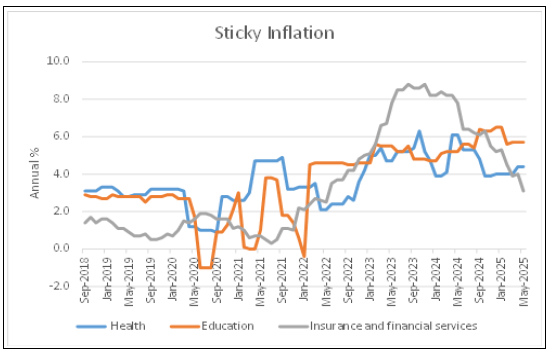
(3) Inflation has fallen over the past 9 months due mostly to the one-off electricity subsidies that has flowed into all CPI components to varying extents, however, there has also been a significant fall in Insurance and Financial Services inflation through competitive forces pushing down prices. We expect that this competitive downward pressure will abate from June with Insurance companies passing though costs increases with their annual changes to rates. This is likely to be of particular concern in the provision of health insurance.
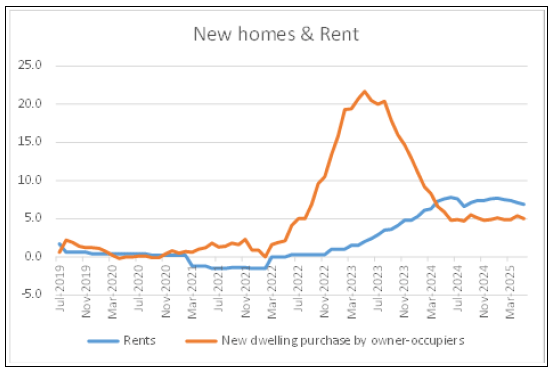
(4) The housing category has a large 22% weighting in the CPI basket. Both house prices and rent costs remain at a high level relative to where they were prior to the pandemic lockdowns. Given the reduction in net migration since 2024 and the pledge by all State governments to support new home construction, we would expect that inflation in the housing category will remain at current levels over the medium term.
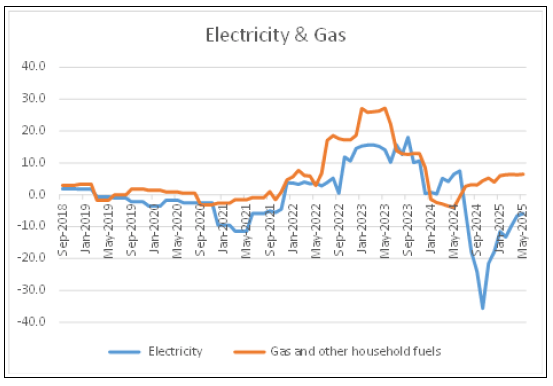
(5) Electricity and gas– The State and Federal government electricity subsidies over the past 15 months have had a dramatic impact on electricity prices. We are now approaching the expiry of the Federal Government subsidy program, and the all the State subsidies have now also expired. This is already being reflected in electricity prices, but we have not yet seen actual increases yet. We would expect that the expiry of the subsidies will bring a sharp price spike in the months ahead that should be more than sufficient reason for the RBA to remain on hold.
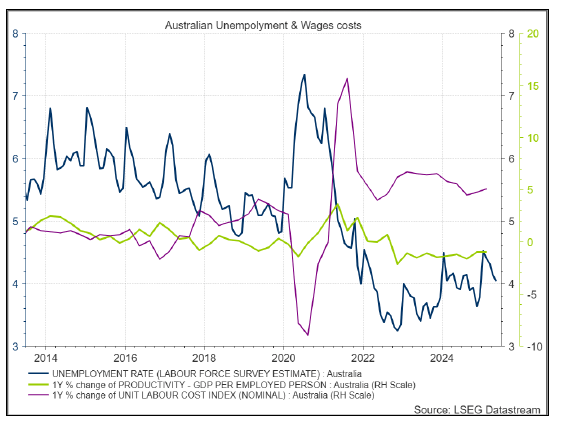
(6) Rising Unit Labour costs – In an Australian context where we have a central bank that strongly believes in the Phillips Curve Theory, (a belief that the government with changes to fiscal policy can control the unemployment and price outcomes) we can see in the chart below that higher inflation in the future is a certainty. Unemployment is well below the full employment level of unemployment -4.25% – while labour participation is near a record level and wages growth is now underwritten at a minimum of 3.5% due to the Fair Work Commissions 3.5% minimum wage increase as of the July 1, 2025. Consistent with this the RBA should have begun reducing monetary stimulus the moment that unemployment fell below 4.25%.
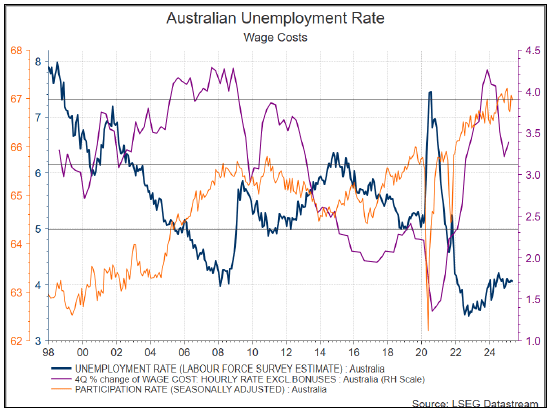
The rise in labour costs and its impact on inflation is central to Phillips Curve Theory, however, labour costs must be considered alongside labour productivity. In Australia where labour productivity is actually declining, we have a real problem. When the RBA said that wages growth of no more than 3% was consistent with its inflation target, it did so with an assumption that labour productivity would be near 1% and at least positive. Today labour productivity is negative and so we need a much lower level of wages growth to see inflation falling (something like 1.5% with labour productivity at negative 1.2%). Unit labour costs spiked as the pandemic lockdowns were lifted due to a surge in small business hiring and while they have declined, they are still well above the level consistent with the RBA inflation target of 2.5%.
The unexpected strength of the Australian Dollar
We view the unexpected strength of the Australian dollar since the Trump Tariff Day April 9 declaration as the light on the horizon for the inflation outlook. This is because in an economy with a free-floating exchange rate (flexible exchange rate as opposed to fixed) the transition path of monetary policy into the real economy is through the exchange rate. Due to the US trade policy changes Australia finds itself in a window where its currency is appreciating despite a worsening trade balance and RBA interest rate cuts. As Australia imports most of its finished goods the currency appreciation may, at least in the short term, push down goods inflation.
Interest Rates
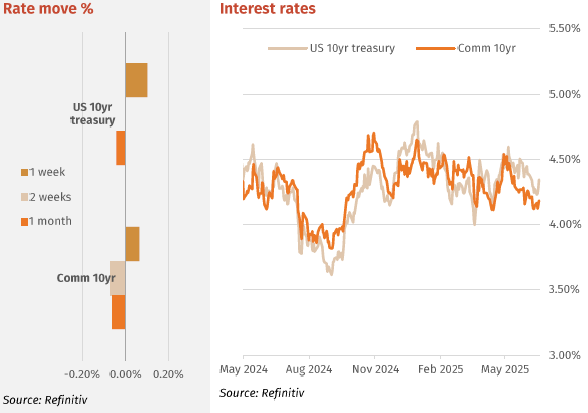
A stronger than expected jobs report combined with the passing of the fiscally expansionist Big Tax Bill to push US yields higher last week. 2-year bond yields rose from 3.75% to close at 3.88%. The key 5-year yield rose from 3.83% to 3.93 and the 10-year increased from 4.28% to close at 3.34% in thin trade after the 4th of July break. The expiry of the Tariff pause window on the 9th is likely to see a return of bond volatility. Currently the MOVE index is at lows along with the equity market VIX. It’s quiet … too quiet.
Bonds yields moved slightly higher last week partially tracking the US curve at the long end and reflecting some nervousness that the interest rate cut at the RBA July meeting may be deferred to August. In the previous week, the market with the heavy influence of the major banks was 100% priced for a 25bps cut but even the language from the major banks was softening by the end of the week. The comm. Gov. 10-year bond finished at 4.18% a rise of 0.06% for the week.
Major Credit Markets
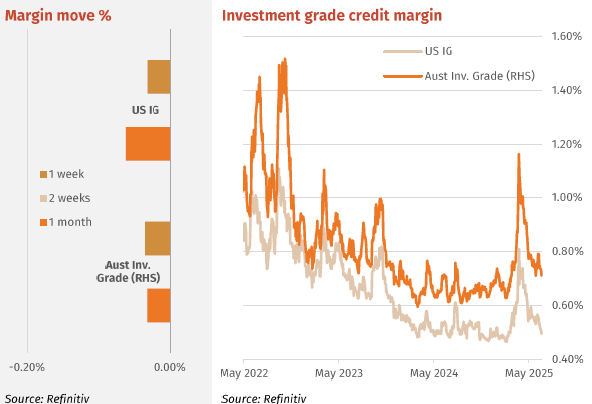
US Investment grade (IG) credit remained strong with the stronger than expected June nonfarm payrolls economists’ expectations of a more dovish Fed, the macro backdrop continues to be supportive of credit markets. Buy flows dominate IG especially from Asia. Margins in US IG contracted across all subsectors with Media being especially strong in recent weeks.
Australian IG credit was firm with major bank senior bonds finding demand over the week. The US holiday disrupted markets, shown by a quiet week in issuance with Rabo coming with a new 5-year bond and Suncorp a 12-month note. The Rabo spread set at +86bps well inside a previous 5-year at +93bps that has traded poorly in the secondary.
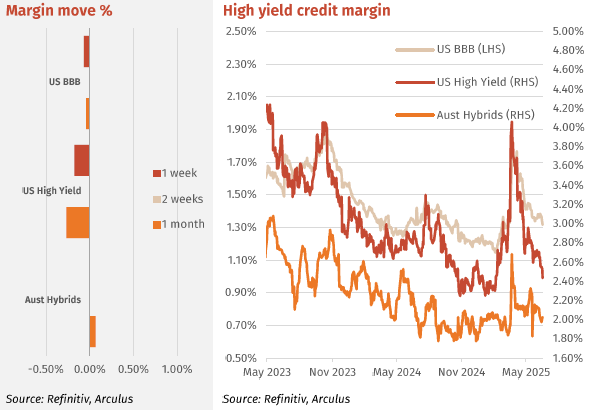
High Yield Markets
Global High Yield (HY) markets remain very strong following IG’s lead and supported by strong equity markets. Primary volumes for June peaked at US$36.8bn, making it the busiest month for US junk bond sales since September last year, when issuers raised a total of US$39.1bn, according to IFR data. However, CCC bonds are lagging the returns on better rated bonds especially BB where demand is very strong. Interestingly risker payment-in-kind bonds are once again making an appearance, these being bonds where the coupon is paid via more bonds not cash. Always a sign of market largesse
The hybrid rally that began in June continues with the average major bank hybrid margin falling breaking through 2% to 1.98%. Major contractors were CBAPL. NABPF, NABPI, NABPJ and WBCPK. CBAPL and CBAPJ widening in spread. The was strength in the non majors and they followed the recent rally in the majors. Last week BENPH, BOQPF, CGFPC/PD, IAGPE, MBLPD and SUNPH were all strong showing a margin falls of 0.20% or greater.
Listed Hybrid Market
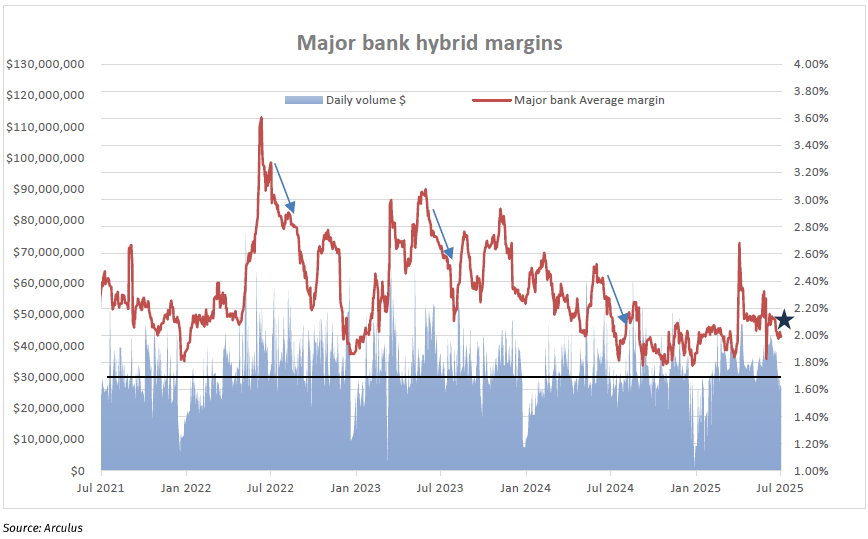
Hybrids – July rally’s common
July tends to be a strong month for hybrids. This July may be no exception. After a strong rally in June where the average major bank hybrid margin fell from 2.32% to 2.00%, in this first week of July the average margin fell further to now be under 2%. The chart shows the average margin since June 2021. The arrows show the margin direction in Julys. The current period marked by the star appears to be heading this way. This effect is similar to that observed in Januarys – where portfolio buying enters the market and margins fall. Structural support is also evident. The hybrid market is shrinking, with few new issues expected in 2025 and beyond, aside from select insurance company hybrids or occasional bank issues. APRA continues to permit new bank issuance, but only as a like-for-like replacement of maturing hybrids.
Forward Interest Indicators
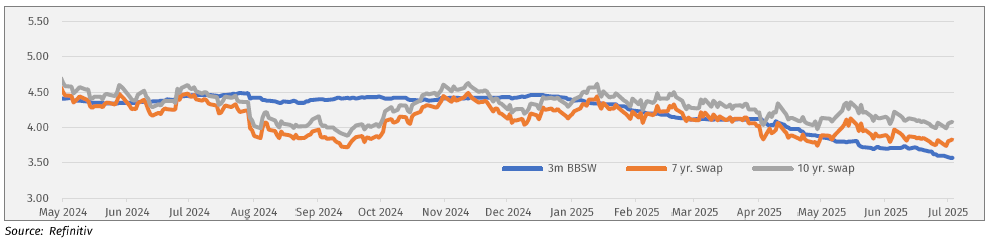
Australian rates
- Swap-rates steady with bond rates waiting for RBA rate cut.
- Swap rates:
10-year swap 4.08%
7-year swap 3.83%
5-year swap 3.61%