

There has been a lot of commentary from all sources about the correlation between the USD, equity and bond markets in April. Several Fed Governors, market strategists and large investors have all given their opinions on why this occurred. They are all desperately trying to make something simple complex. The USD, Equity Markets and Bond Markets ALL fell simultaneously because they were All overvalued.
Senior Federal Reserve official puts ‘50-50’ odds on tariffs sparking sustained US inflation
The mounting pressure on bond markets
Look at it another way. Had the bond market been cheap at the time of the Tariff announcements, would bonds have fallen? Would equities have fallen if instead of the Trump bump there had been an equity market sell off when he was first elected because, after all, the rational equity market is supposed to be able to anticipate economic change and Trump was adamant throughout the campaign that he saw Tariffs as the answer for everything. The US asset markets have all, for some time now, been priced for a perfect outcome. Perfect is the enemy of the good. The US economy may well come through this difficult period better than many expect, but will this be good enough for the valuations implied by US asset markets?
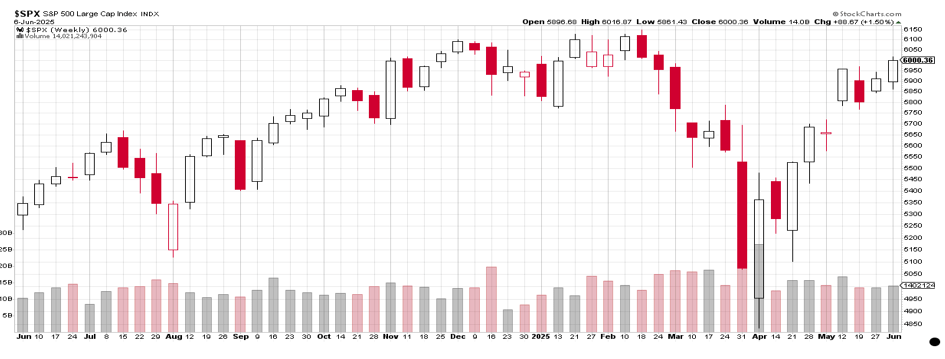
The equity market is basically back to the overvalued levels it reached after the Trump bump. What would it take to justify it rallying from here? Will Mag 7 EPS growth alone be enough to keep propelling the S&P index higher? Will all the Mag 7 be able to grow EPS at double digits?
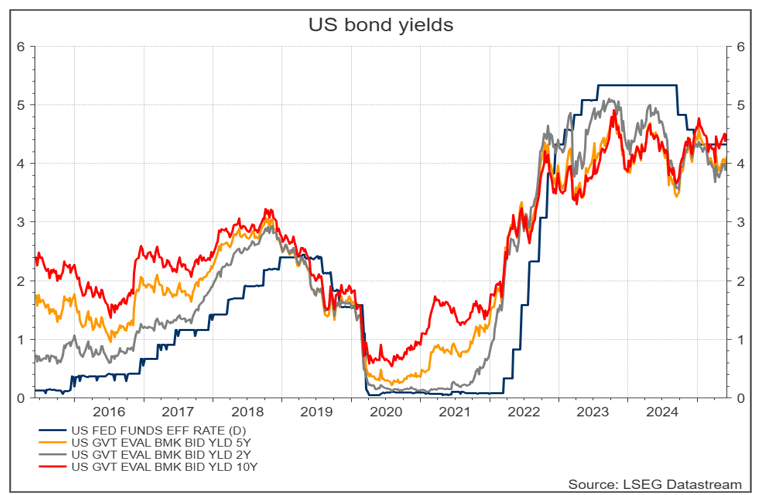
The yield on the US 10-year bond has been near 4.50% for over 12 months now. Too many market participants are simply expecting the Fed to take the official rate back to where it was in 2018 and that the 2-, 5- & 10-year bond yield will simply follow it to the same levels. These levels reflected the US economy being trapped in a period of secular stagnation (low inflation and low growth).
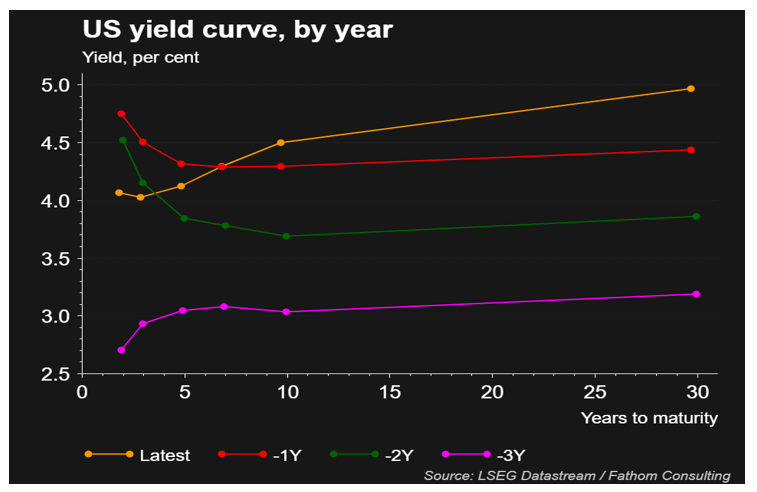
Another way to look at the US bond market is the shape of the yield curves over the past few years:
- Three years ago, we had pandemic lockdown monetary policy, inflation and GDP growth expectations. This is a yield curve we don’t want to ever see again.
- Two years ago, the inverse yield curve was widely interpreted by the market as a signal that the US economy would be in recession within 9 months. The markets combined this signal with ISM composite readings below 50. Together these two signals had had a 100% track record of predicting a recession. The signals had been distorted by the pandemic and the US recession in the March quarter of 2024 never happened. What the bond market was signalling is that the much of the inflation was in fact ‘transitory’.
- The current positive yield curve is not signalling a recession but an economic expansion. This yield curve is NOT forecasting that the Federal official rate, 2-, 5-, 10-year yields will return to 2018 levels.
The tariff pause and the theoretical tax revenue associated with it combined in May with the Trump Big Beautiful Tax Bill to raise concerns of key bond market participants over the sustainability of the US Governments fiscal position. At this stage these concerns have not manifested to anywhere near a crisis level, however, the fall in demand – relative to 2024- at several Treasury bond auctions in May is possibly an early warning sign. There are perhaps several issues brewing that may lead to a sharp rise in US Treasury yields this year that include:
• The increasing size of the US government financing requirement Wall Street Is Sounding the Alarm on U.S. Debt. This Time, It’s Worth Listening. – WSJ.
• The unwinding of the Yen carry trade. Any respite for Japan’s bonds is likely to be short-term.
• The role of the USD as the global reserve currency diminishing. This may result in countries like China that have large trade deficits with the US no longer having the same demand for US Treasuries. The Dollar Is Close to Multiyear Lows.
• Much like in 2008 the longer volatility remains high the greater the risk of a systemic like event being triggered. Already the costs of hedging currency risk means that foreign investors in US Treasuries make no money on the basis of a hold to maturity yield. Global Investors Have a New Reason to Pull Back From U.S. Debt – WSJ.
• Rising inflation risks linked to the US tariff induced disruption to global supply chains. The markets appear to have jumped too far forward with their predictions of a US recession (not reflected in the S&P current level) connected to the tariffs. The market is not allowing for the natural and logical lags between the imposition of a tariff, the impact on US consumer demand, the shift of the factors of production in the US to import substitution and the tariff responses, particularly from developing economies. Well before we have an impact on Eco Growth, we will see a spike in inflation. Senior Federal Reserve official puts ‘50-50’ odds on tariffs sparking sustained US inflation
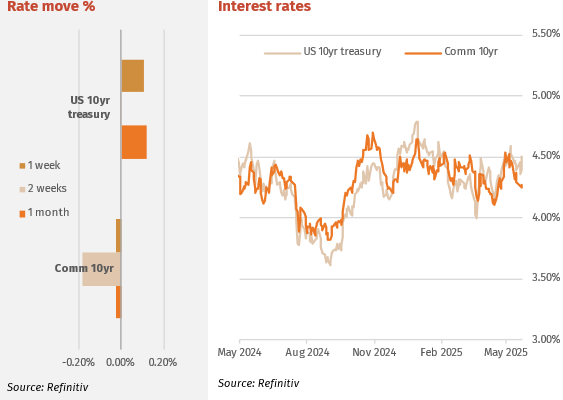
Interest Rates
A much better than expected non-farm payrolls number of 139k produced a panic in the bond market with yields rising markedly at weeks end (more in commentary below). Right across the curve yields on Friday night rose 11 bps with the 2-year finishing at a 2-week high of 4.03% and the 10 year 4.504%. The market quickly backtracked on expectation of a September rate cut, however a December one is still expected. Next week’s CPI and PPI readings will be telling.
Australian bonds in NY trading tracked changes in US bonds across the curve with the 2-year yield rising 10bps to 3.37% and the 10-year moved from 4.23% to 4.39%. In the background Australia’s weak GDP data confirmed the economy is in poor shape, with the drop off in business investment and the march of emboldened unions seeking higher wages and less productive work conditions. Households are in no better shape, with the roll-off of energy rebates and a preference to rebuild savings buffer than spend. The effect of government spending is starting to diminish.
Major Credit Markets
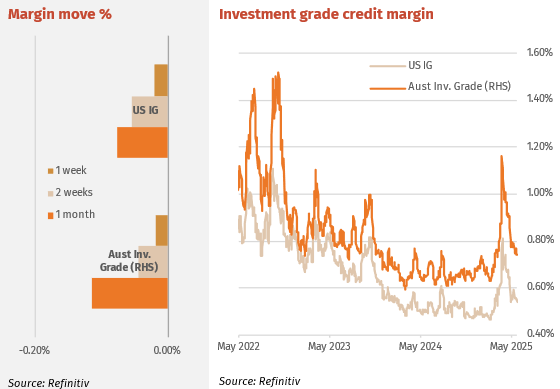
Credit markets are rallying again after a brief pause following the April credit spike. A late week equity rally signalled “risk on” with corporate bonds finding lots of buyers. Issuance across the credit spectrum is strong as companies have opportunistically rushed to market given long bond rates had slightly dipped (prior to the end of last week) and credit spreads had rallied back. This shows companies are worried about rising rates and possibly being caught out by bad timing if coming to market to raise in a credit spike.
Credit margins in Australia were unchanged at senior and sub levels last week. Ongoing strong demand was matched by a weaker than expected March qtr. GDP number and new supply. Judo issued a 3-year senior at 145bps over swap and Melb airport issued $1bn 30 year non call 5.25-year subordinate debt at +205bps. This looked very expensive relative to the current APRA regulated bank Tier 2 issues and the shorter-dated Kanga Tier 2’s that are generally trading at the same margin.
High Yield Markets
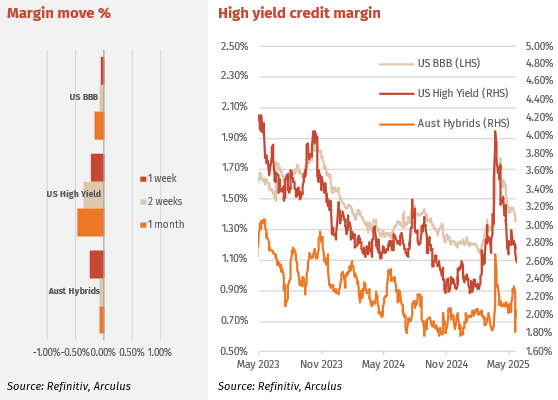
Global High Yield (HY) markets rallied with US equity markets showing some signs of steadiness. As with IG, issuance has been strong with a 12-month record reached last week. HY companies are raising before tariff and production costs are evident and any softening in profits. Issuing now, whilst balance sheets are strong and default rates low, makes sense. Further, the margin curve is quite flat giving companies an incentive to do longer-term issues.
A topsy turvy week for hybrids with the previous weeks flat margin curve abating and the usual positive shape reinstated. Much of this was driven by three of the four major bank hybrids going “ex-dividend” and holding much of the attached franking credits. This showed buying cum-dividend is the best approach. With much of the franking held, the impact was to lower credit spreads and hence the major bank average hybrid margin fell 0.25% for the week, however this is somewhat artificial and tends to right itself in the subsequent weeks. Westpac hybrids all go ex-div on this Thursday June 12.
Listed Hybrid Market
Hybrids – once upon a time in a rational land.
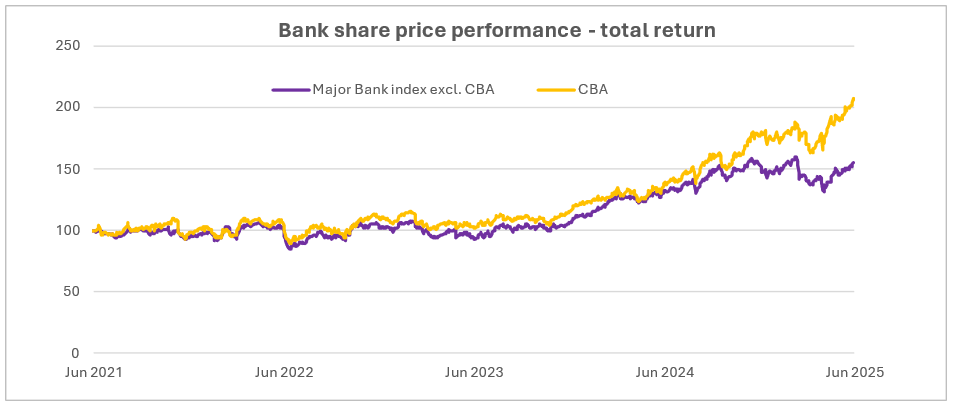
Not just Australian, but global investors are looking at the performance of CBA and its eye watering PE ratio, especially for a plain vanilla mum and dad mortgage provider. CBAs performance has outpaced the other three major banks as shown in the first chart below, especially since June 2024. What does this mean for hybrids? If hybrids were a true “hybrid” security then the strong equity performance, especially by CBA, should show up in hybrid pricing. However, hybrid margins are well off December lows.
The second chart shows each banks average hybrid margin for hybrids with more than 12 months to run (this removes short term hybrid pricing distortions). As shown the average margins are quite similar, although for CBA since June 2024, there has been at times a slightly lower margin that the others. This somewhat dovetails with some expected pricing premium as a result of the strong share price discussed above. However, this can be explained another way. Currently the average tenor of a CBA hybrid is 3.06 years, whereas for ANZ, NAB and WBC the average tenors are 4.28, 4.03 and 3.92 years respectively. The longest tenor CBA hybrid is CBAPM at June 2030, whereas the other three each have a hybrid with maturity well into 2031. So, any average margin chart should reflect CBA’s shorter average tenor. In fact, the very small margin discount in the chart is even a bit small for the 12 months average tenor. Hence it can be concluded there is no pricing premium for CBA hybrids.
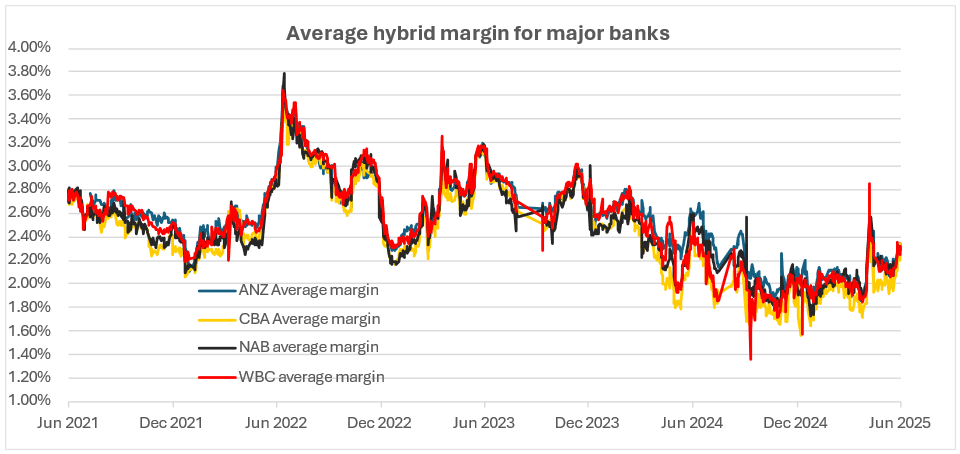
However, there is a message. The strong bank share price performances do help show the health of the bank. As a result, buying a CBA hybrid at any point on the margin curve at the same margin of another major bank is good value. Under market stress, this will shine through.
Forward Interest Rates
Australian rates
Swap-rates rose with bond rate moves.
Swap rates:
– 10-year swap 4.22%
– 7-year swap 3.97%
– 5-year swap 3.75%|
– 1-month BBSW 3.76%