
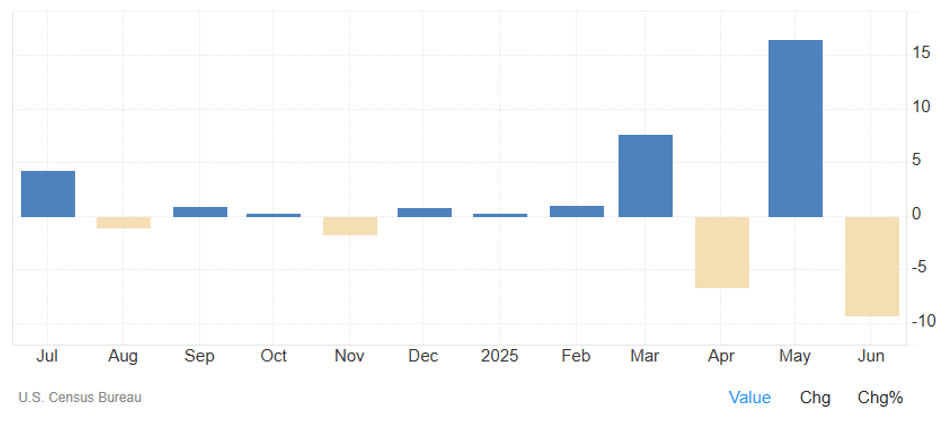
The only real or hard bit of economic data last week was the US durable goods data. For economists, who understand economic theory, the durable goods data is a key forward indicator because the ex-defence durable goods data is a good proxy for business spending plans (Capex). Last month ex-defence durable goods declined 0.7% when a 0.2% rise was expected.
It is important to remember that the durable goods data has been distorted by the trump tariff policy intentions, tariff announcements, tariff pause window and now the tariff implementation agreements. We are not going to base any of our economic forecasts on the durable goods data until the increase in inventories prior to April 9 have been fully unwound.
Equally economists, investors and the inept media should not be rushing to judgement on the inflationary outcomes of the tariff agreements until after the inventory buildup has been unwound. The message is that the tariffs are inevitably inflationary, and the impact has only been delayed by the way Trump has conducted the policy change.
The chart below clearly demonstrates just have volatile the durable goods data has been over the past four months.
US Durables Goods Index
Interest Rates
The bond markets were listless last week with a lack of hard economic data to steer them. The main piece of soft data was the S&P PMI ‘s that showed a pick-up in activity 6-9 months ahead. Both the Fed and BOJ are expected to hold rates at their meetings this week.
Yields finished steady with the week before due to a lack of new data. This week’s CPI data will be the focal point for the markets. Governor Bullocks speech last week dismayed the banks that have been hoping and pricing for an August rate cut when she pointed that last month’s tick up in the unemployment rate was not consequential and that the expiry of the electricity subsidies will mean inflation will begin rising again shortly.

Major Credit Markets
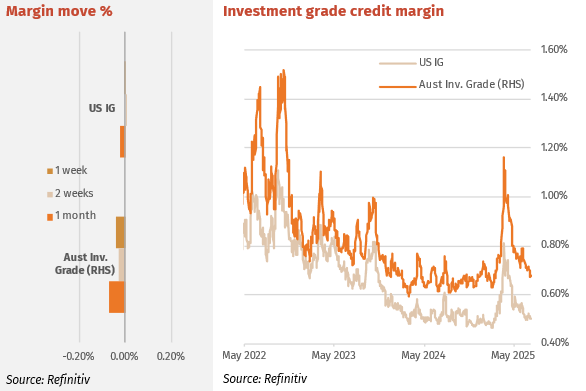
US Investment grade (IG) credit remained steady with spreads were unchanged as investors assessed earnings and ongoing tariff negotiations while closely watching President Trump’s visit to the Federal Reserve
Australian Major bank credit spreads traded into the tight levels last seen in February due to a lack of new supply. There is now very little if any value in trading major bank senior, so the focus has begun to shift to regional and mutual bank senior bonds that are still trading wider than February levels. Major Bank Tier 2 margins also contracted into very tight levels with the 5-year call bonds near 143bps. Major Bank Senior and Tier 2 now offer little value.
High Yield Markets
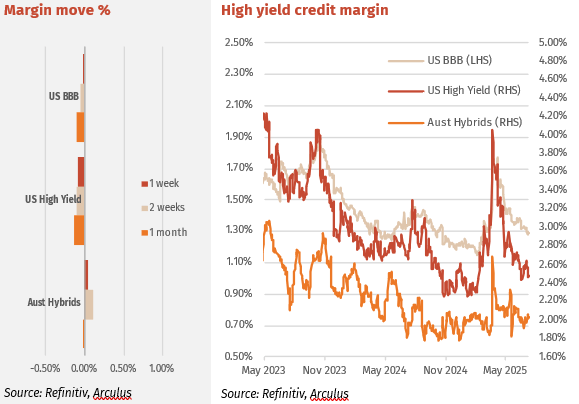
Global High Yield (HY) markets power ahead of benchmarks. Average US high-grade spreads were unchanged at 79bp on Thursday. US high-grade corporate average credit spreads are now unchanged YTD with 2025 YTD volume US$1.003trn vs 2024 YTD volume US$997bn.
The Hybrid market was steady last week with average volumes, however turnover centred in the middle of the curve as opposed to the usual front and back ends. CBAPL June-28 maturity led volumes, followed by Dec-27 NABPH. With the hybrid margin curve steep, buyers are moving from skinny margin 12–18-month maturities to 2-3-year issues.
Listed Hybrid Market
Hybrids – bank share price volatility impacts margins.
The relationship between bank hybrid margins and bank share prices is underpinned by a set of financial and behavioural linkages. In Australia, this relationship can often appear binary in nature: when bank share prices weaken, it raises broader concerns about the health of the institution—earnings pressures, rising credit or lending risk, or regulatory impacts. Since hybrid securities are perpetual and their distributions discretionary, deteriorating equity market sentiment can feed directly into fears of postponed repayments or missed coupons. Conversely, when bank shares are buoyant and confidence in the sector is high, hybrid margins typically tighten or at least move sideways.
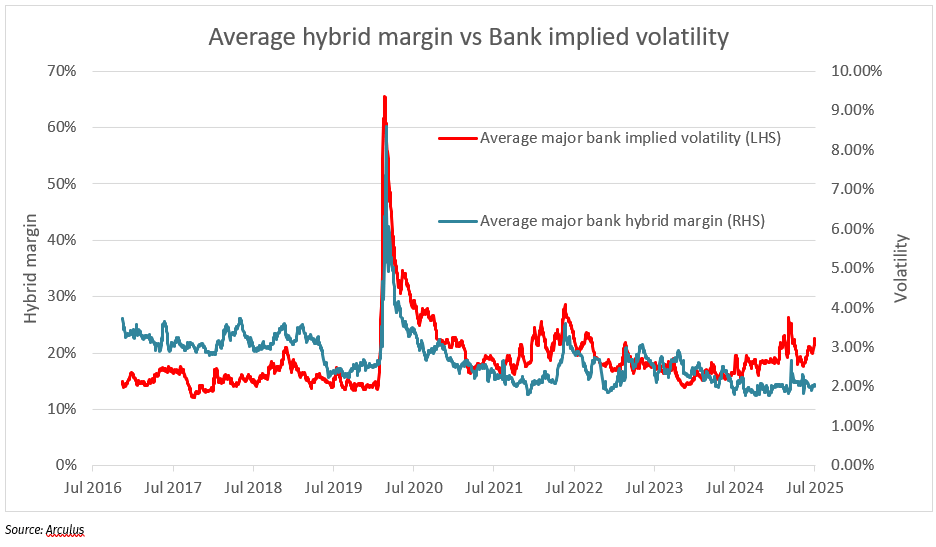
One valuable lens into the market’s sentiment towards bank share prices is option-implied volatility, a forward-looking gauge that reflects expectations of future share price movement. Typically, a rising implied volatility reflects falling share prices or heightened views on market risk. When share prices are stagnant or trending higher, implied volatility is typically low and stable. The chart below captures the relationship between average hybrid margins (blue line, right axis) and implied volatility of major bank shares (red line, left axis). Historically, periods of rising implied volatility—often linked to share price weakness—have been accompanied by widening hybrid margins. This correlation makes sense as rising volatility implies elevated risk, prompting investors to demand a higher return for holding subordinated, potentially perpetual instruments such as hybrids.
However, the most recent data points show a potential divergence. Implied volatility has recently surged, suggesting growing market nervousness—possibly linked to the 3.54% weekly decline in a major bank index and a significant 10% drop in CBA alone. Yet, hybrid margins have remained largely stable. This disconnect may be short-lived or reflect a shift in market structure, but it is noteworthy given that in past episodes similar volatility spikes led to swift repricing of hybrids. Whether this lag is due to investor complacency, structural buying, or a delayed reaction remains to be seen, but it will be important for hybrid investors to watch if margins catch up to the volatility move. A lead indicator will be the continued weakness in bank share prices.
Forward Interest Indicators
Australian rates
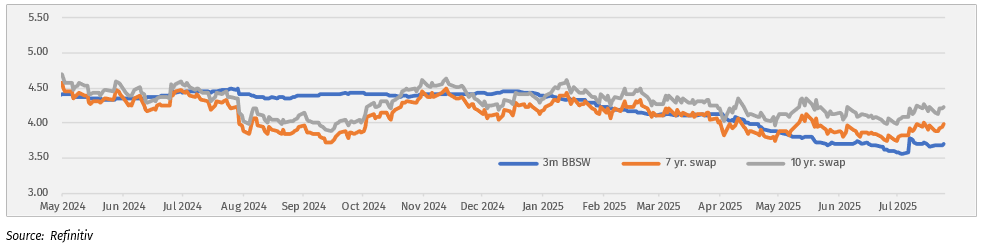
Swap-rates steady with bond rates.
Swap rates:
- 10-year swap 4.22%
- 7-year swap 3.98%
- 5-year swap 3.77%
- 1-month BBSW 3.70%