
The 90-day BBSW rate surged 19bps to 3.76% after the RBA decision to leave rates on hold at the July meeting and finished the week at 3.72%. Some market participants are still wanting to believe that a rate cut will occur in August, but we strongly believe that expiry of the large electricity subsidies (State and Federal combined) will see inflation begin to rise from July onwards. This has been the case in the UK already and is beginning to show up in EU Area data.
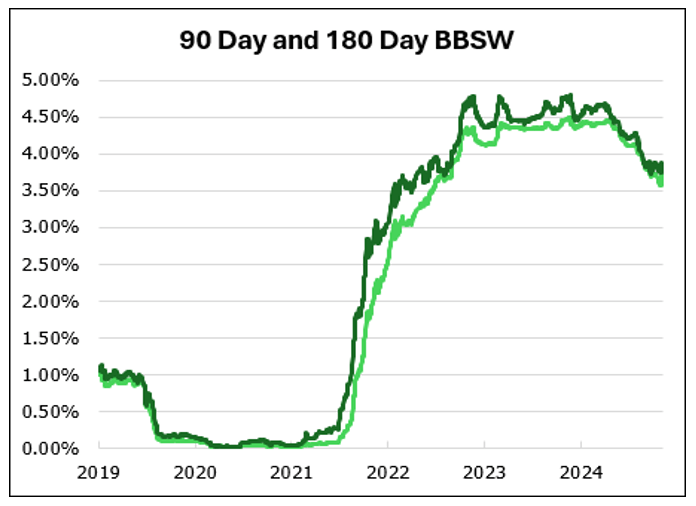
The markets are still pricing rates to fall to 3.37% over the next 12 months and then begin to rise again. We do not put much faith in the market’s predictions based on the 90day BBSW because it is, by definition, not an efficient market given it is dominated by the major bank oligopoly.
There has been a deluge of articles about the RBA decision to leave rates on hold and when reading them we need to keep in mind a few inconvenient facts:
- The RBA has a defined mandate, and the decision-making committee comprises 9 voting members. The fact that three voted for a cut is not at all relevant when they will have been the three external appointments made by the ALP since 2022.
- Pure economics determines the mandate outcomes:
- Full employment defined as an unemployment reading below 4.75%.
- Financial sector stability.
- Stable inflation defined now as an average reading across the economic cycle of 2.5%.
- RBA policy actions must always be based on pure economics not politics.
- It is not the job of the RBA to guide our banking oligopoly to knowing in advance changes to monetary policy. The RBA decision is made at the two-day meeting of all the interest rates setting board members.
- It was the banks that got the RBA call wrong because they were not using their army of economists to employ unbiased thinking. Instead, we have a huge economic resource in Australia that will always predict rate cuts because their employer’s business model is based upon borrowing short to lend long term.
Our job is to profit for our investors from the RBA mistakenly varying from pure economics for political reasons and our banking oligopoly forecasting outcomes not based on pure economics. Anyone that questions the fact that the RBA will make mistakes need only be reminded that three of the nine voting members actually called for a cut at the July meeting when the economics was crystal clear. If it was crystal clear in July it was also clear at the February and May meetings when the RBA cut rates – something that may be regretted by the end of the year.
Given the increased likelihood of higher official rates for longer investors should be avoiding long duration bonds as they offer an inferior risk for return outcome. The risks to fixed rate bonds in the 5–10-year part of the curve are not just here in Australia as our yields track changes offshore too.
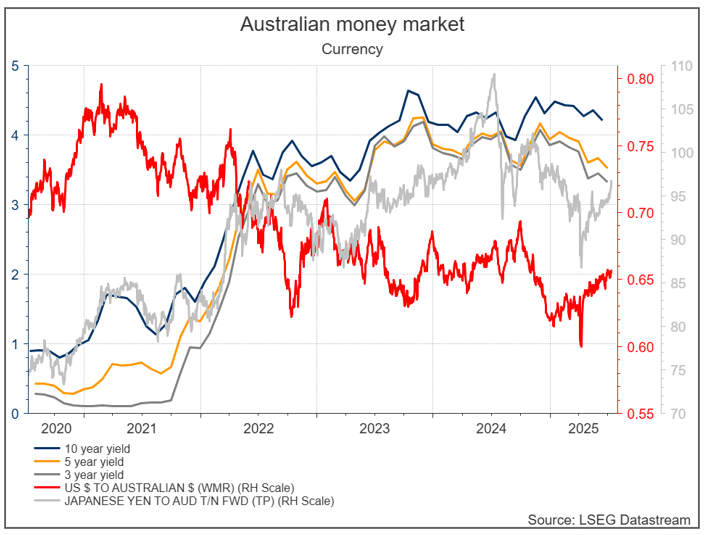
First the good news. The anti-Trump legion, which are calling for the USD to weaken further materially, are inadvertently helping Australia. Investors in Japan and China appear to be switching away from US bonds and into Australian bonds. The June quarter saw the largest volume of bond buying from Japan since 2021 and this explains why recent issues have been priced so tightly. It is also one of the reasons our currency has been so strong recently.
Interest Rates
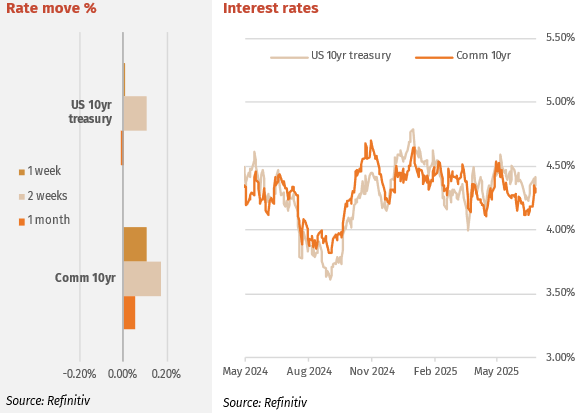
US Treasury yields moved higher last week, driven by several factors. First, markets reacted to former President Trump’s revised tariff proposals, which reignited concerns about global inflation—taking sentiment back to early April. With US CPI data due next week, expectations around a potential Fed rate cut remain sensitive. Second, jobless claims surprised by falling unexpectedly, signalling continued labour market strength. Third, recent commentary from Fed officials showed little urgency to cut rates. Finally, a lack of new buying interest contributed to upward pressure across the curve. While 2-year yields rose only modestly, longer tenors saw more moves: the 5-year increased by 0.04%, the 10-year by 0.07%, and the 30-year by 0.094%.
A combination of rising US yields and the RBA’s decision to hold rates pushed Australian bond yields higher last week, particularly at the short end. The 2-year climbed 0.14% to 3.434%, the 5-year rose 0.12% to 3.633%, and the 10-year increased 0.14% to 4.33%. These moves reversed the downward trend seen since mid-May, with yields now well above late-June levels, the 10-year now in the middle of its 9m range.
Major Credit Markets
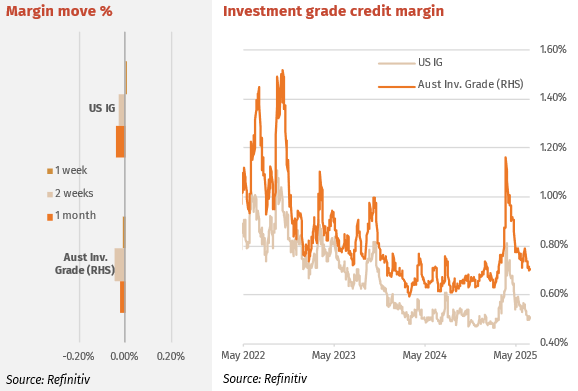
US Investment Grade (IG) credit investors showed signs of caution last week amid uncertainty over how the latest tariff salvos from Trump may unfold. IG credit spreads widened slightly as markets reassessed geopolitical and inflation risks. Softer demand in primary markets contributed to the mild repricing of credit risk. US IG credit spreads ticked slightly higher.
Australian IG credit was firm with good issuance. The pricing of the Macquarie Bank 5-year senior bond last week at 82bps was something of a shock. Only a few weeks ago Westpac issued at the very tight 83bps a 5-year Senior and it has struggled in the secondary market to hold this level. Apparently, the big credit funds that are dominated by quantitative not qualitative managers cannot tell the difference between the tiny Macquarie Bank rated A+ (not Macquarie Group) and a major bank. Worse still they ignore the difference in credit ratings! The credit market is very hot right now.
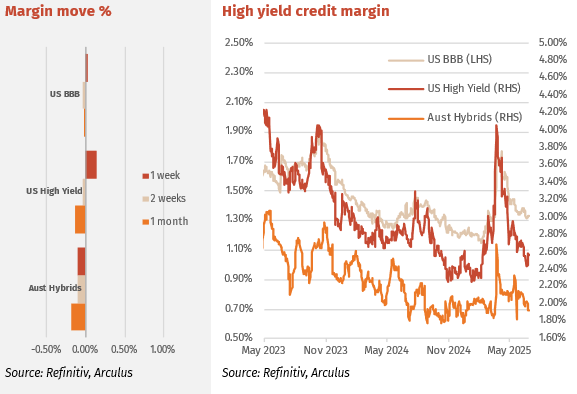
High Yield Markets
The strong run in High Yield (HY) markets paused last week despite good equity markets. The re-igniting of tariffs caused some dislocation in HY sub-sectors. Retail and energy sectors were weak whilst telecom and automotive sectors were strong. A new entrant to the global HY market last week was Nissan Motor. Downgraded to Junk in February, Nissan is now a BB credit. The Nissan US senior unsecured 5, 7 and 10 bonds were issued at margins of 3.55%, 3.60% and 3.76% respectively over treasuries.
Hybrid securities remained strong, with the average margin on major bank hybrids falling by 0.075% to 1.91%. However, trading volumes have declined significantly, now sitting well below the typical daily average of $31 million. Most hybrids are trading below their usual volume levels, except for MQGPD, MQGPF, BOQPG, and CBAPI, which are above. Notably, WBCPM, WBCPJ, CBAPM, and MQGPF are seeing particularly low activity. This decline in trading reflects a lack of willing sellers amid tightening hybrid margins. See the next page for a breakdown.
Listed Hybrid Market
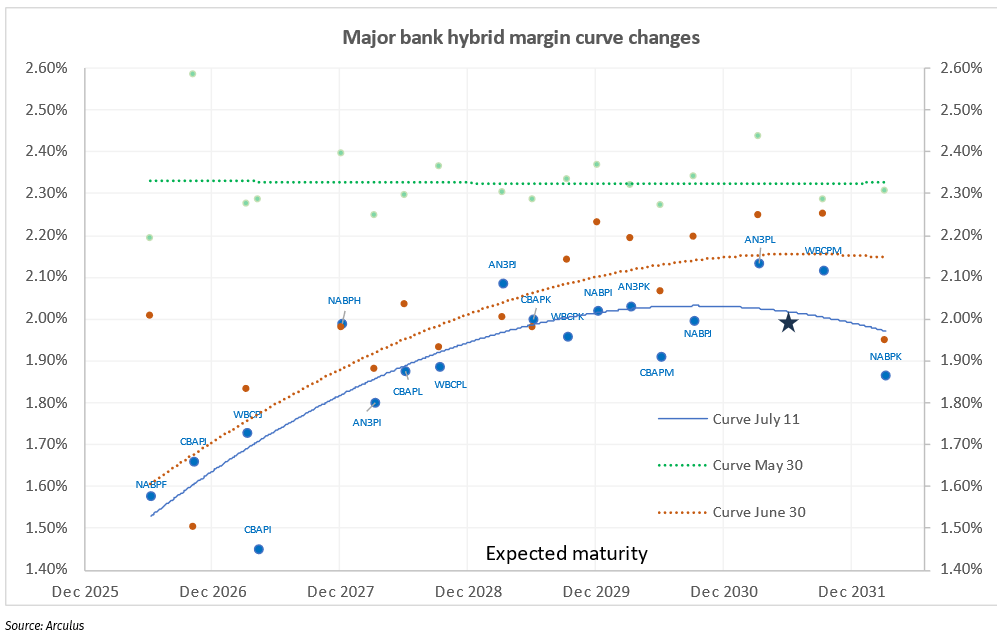
Hybrids – rally moves the curve.
As noted in recent weeks, hybrids have continued their strong rally. The chart below illustrates the movement in margins for major bank hybrids since May 30, with each curve reflecting a different date. At the end of May, the margin curve was unusually flat—an atypical structure for hybrids, as it offered little in the way of term or risk premium.
Since then, the entire curve has shifted lower, with the short end tightening most notably. NABPF is a prime example, with its margin contracting sharply. In contrast, NABPH started with a wide margin on May 30 and has remained relatively steady around 2%, presenting good value given its December 2027 maturity.
NABPK, the longest-dated hybrid in the listed sector, appeared fairly priced at the end of May but has since compressed more than comparable securities such as AN3PL and WBCPM. NABPK now looks relatively expensive for its term.
Forward Interest Indicators
Australian rates
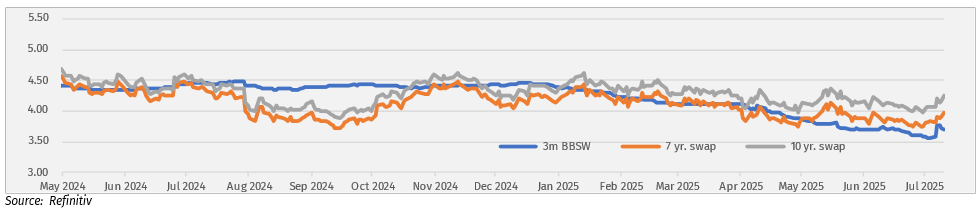
Swap-rates rise with bond rates waiting after no RBA rate cut.
Swap rates:
- 10-year swap 4.24%
- 7-year swap 3.99%
- 5-year swap 3.7%
- 1-month BBSW 3.79%